
Let's Learn
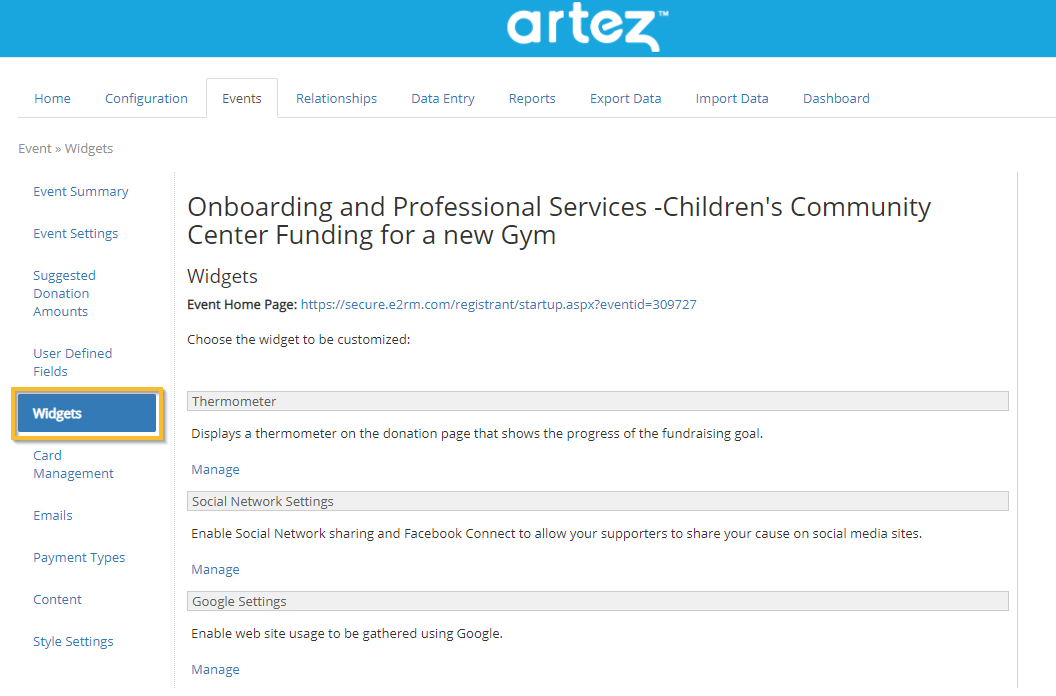
In the Widgets section, you can enable the Thermometer, Social Network Settings, and Google Analytics.
To enable any of these widgets, click on the Manage button under the respective categories.
How to Manage the Thermometer
The Panorama Tribute Project now includes the ability to add a fundraising thermometer to the homepage, giving participants and donors a way to visualize the success of the campaign. This is a great way to motivate and encourage supporters with a gamified giving experience, helping your organization reach fundraising goals while engaging and creating a community with your supporters through a sense of accomplishment.
Step 1: To add a fundraising thermometer to your Tribute homepage click into your Tribute page under the Events tab and click on Widgets in the left-hand Admin Console settings menu.
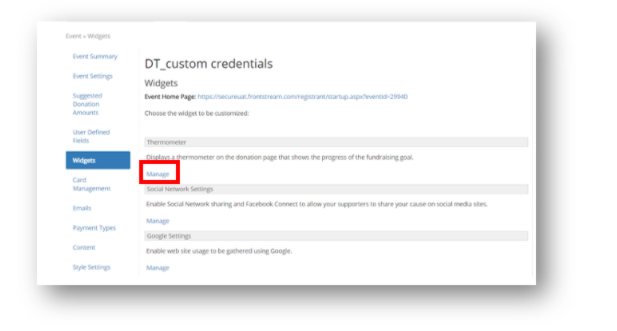
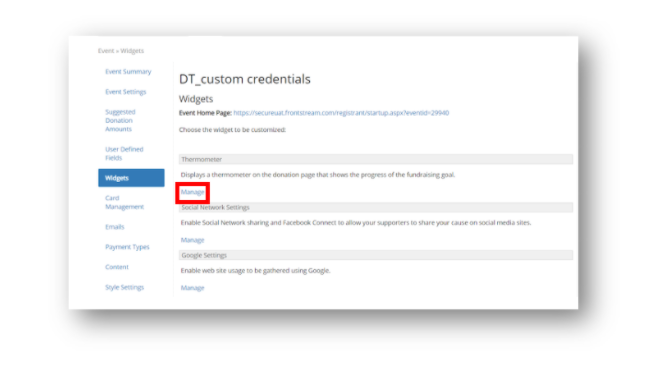
Step 2: Click on the Manage link under the section labeled Thermometer. This will bring up your Thermometer settings.
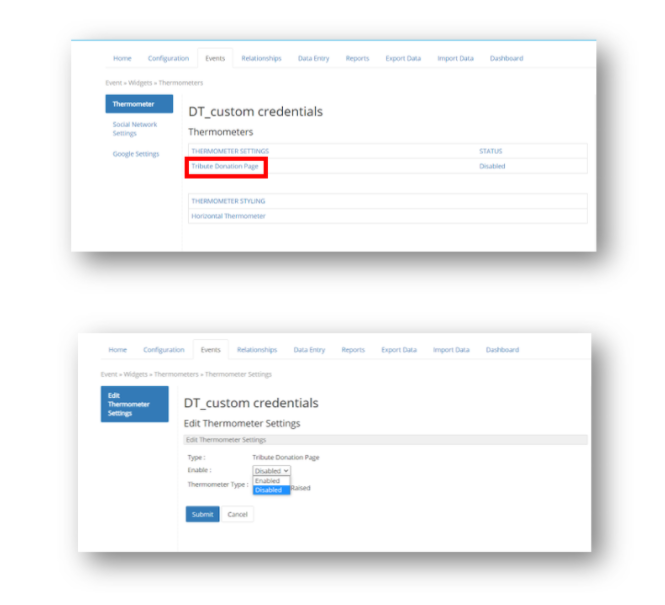
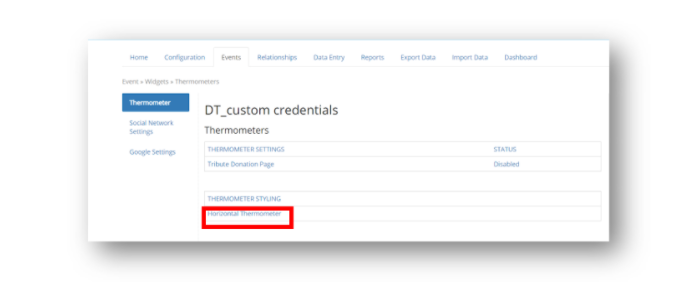
Step 3: Clicking on the Tribute Donation Page link under Thermometer Settings will allow you to enable or disable the thermometer on your homepage. Click Submit to save your changes.
Styling Your Thermometer on Your Tribute Homepage
Step 1: To style your thermometer on your Tribute homepage, click into your Tribute event under the Events tab and click on Widgets in the left-hand Admin Console settings menu.
Step 2: Click on the Manage link under the section labeled Thermometer. This will bring up your Thermometer settings.
Step 3: Click on Horizontal Thermometer under Thermometer Styling to bring up options to customize your horizontal thermometer.
From here, using your organization’s brand colors, you can customize:
- The widget background-color
- The font color of the amount raised and goal
- Thermometer progress bar background-color
- Thermometer progress bar fill color
- Goal achieved progress bar color
- Choose between English or French language
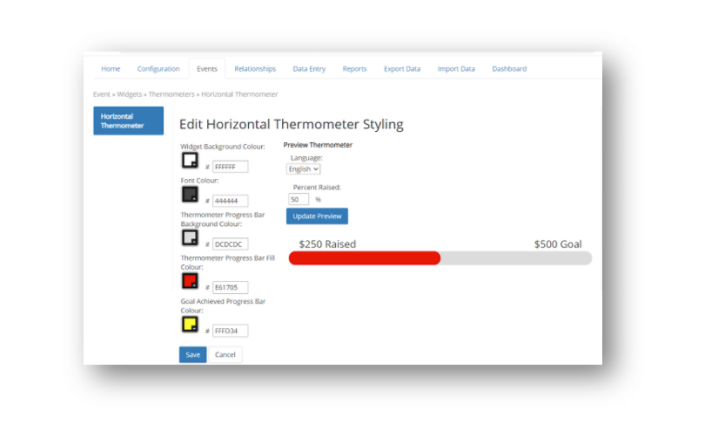
Step 4: From your settings page you can preview what your thermometer will look like before you publish. When you are satisfied with how your thermometer looks click Save.
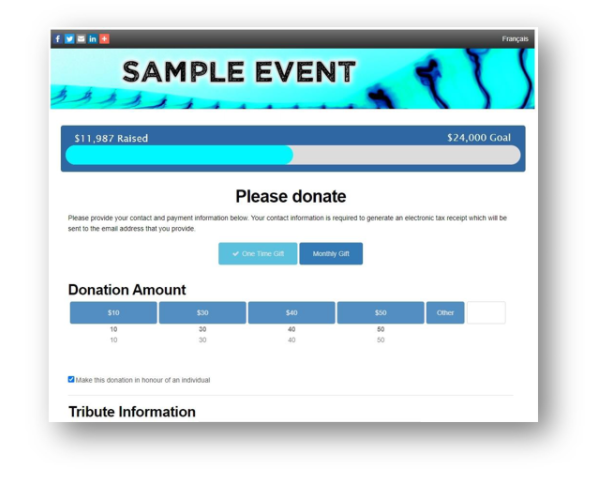
Below is an example of how your thermometer could appear on your page:
How to Manage Social Network Settings
This allows you to enable Social Network sharing and Facebook connect, to allow your supporters to share your cause on social media sites.
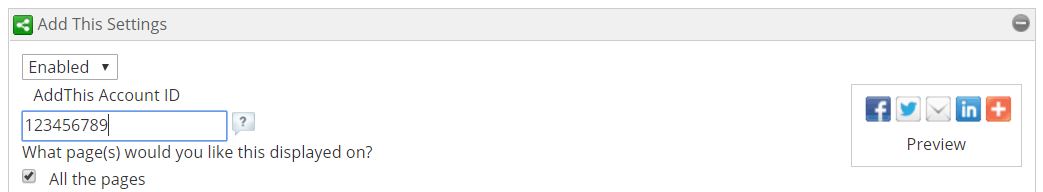
The AddThis Settings let donors share your cause on their social media accounts. You can customize the messages that will populate these boxes.
To Enable the AddThis Setting:
Step 1: Click Enabled under the Add This Settings section.
Step 2: If you have an AddThis account ID, you can enter it here (optional).
Step 3: Once you have enabled the AddThis setting, you can customize your messages that will be prepopulated when your supporters share your cause on certain social media sites.
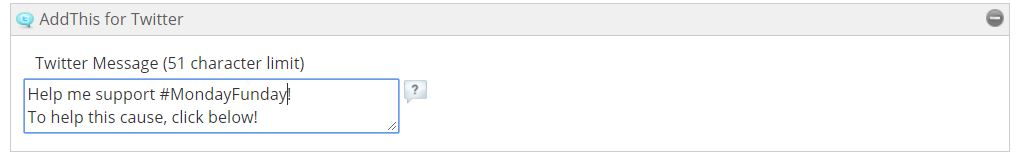
Step 4: Under the section AddThis for Twitter, create a unique message that friends of your supporters will see online. This message will be included along with a link to the page.
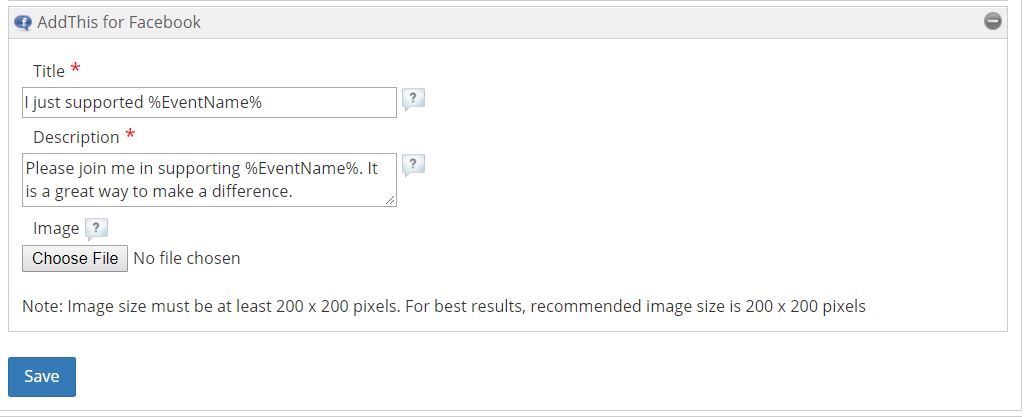
Step 5: Under the section AddThis for Facebook, create a unique message that your supporters will see when this link is shared on Facebook.
Step 6: Under the Title, add in your organization’s name. Key words like %EventName% or %OrganizationName% will automatically fill in with your event or organization name. No need to do the work yourself! Under the Description, think of a short sentence that will help inspire others to donate to your cause. You can add an image that will appear in this link as well. The recommended image size is 200 x 200 pixels.
Step 7: Don’t forget to click Save when you are finished!
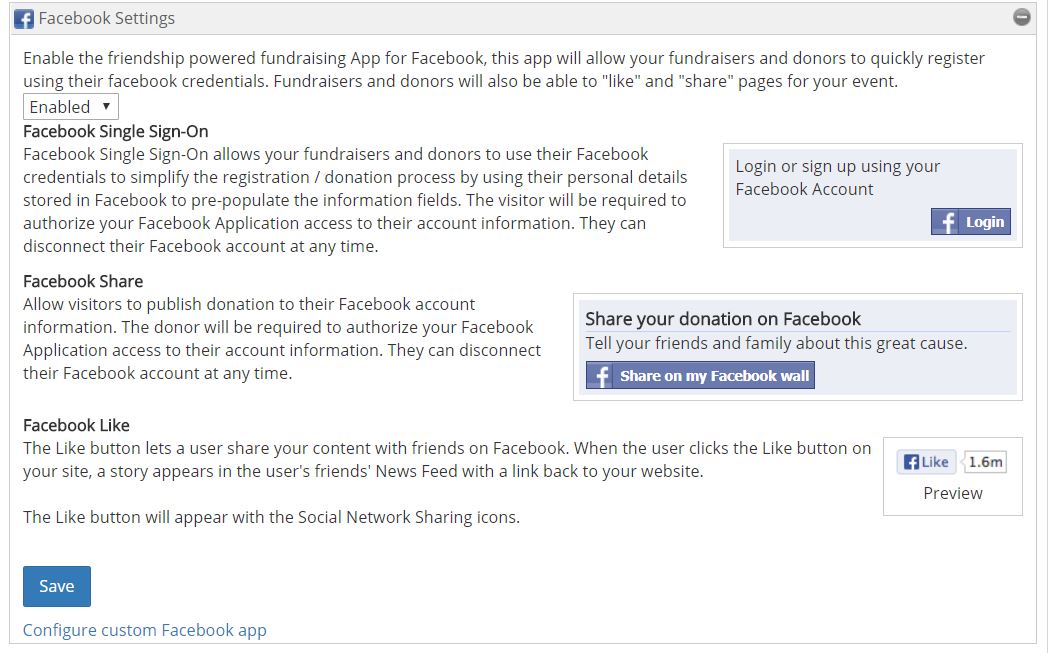
Additional Facebook Settings.
You have the option of keeping these great Facebook Settings enabled. The descriptions are listed below for you (as well as in the product). To turn this off, select the drop down box "Enabled" and Disable it and click save.
How to Manage Google Settings
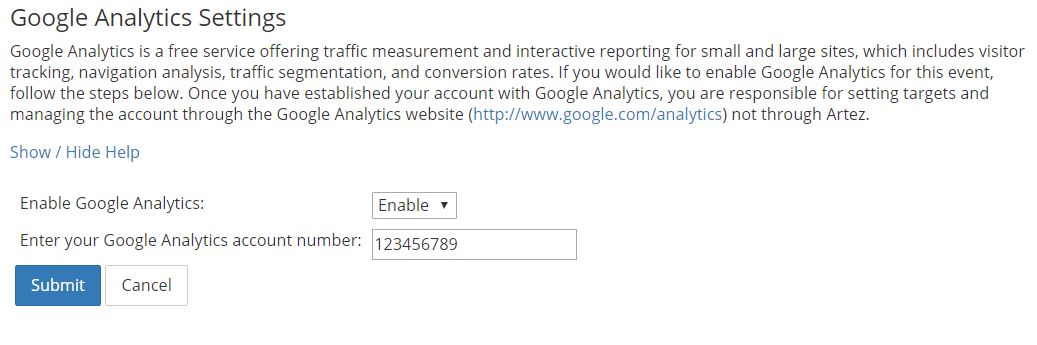
Setting up this feature enables you to link your event websites to your Google Analytics account. This allows you to track information about people who visit your website in order to optimize your Google AdWords.
For example, you can learn the number of visitors, visitor path, conversion rate, and more. You can also learn what kind of browsers your donors are using and see where they are arriving from. This is how your website traffic information might appear on an easy-to-use Google dashboard accessed through www.google.com/analytics.
Comments
0 comments
Article is closed for comments.